The functionalities of Plot2d viewer are available via its Viewer Toolbar. Buttons marked with small downward triangles have extended functionality which can be accessed by locking on them with left mouse button.


Dump View - exports an object from the viewer in bmp, png or jpeg image format.

Fit all - scales the display to show the entire scene. Use this to resize the scene so that it could fit within the Viewer boundary.

Fit area - resizes the view to place in the visible area only the contents of a frame drawn with pressed left mouse button.

Zoom - allows to zoom in and out.

Panning - if the represented objects are greater that the visible area and you don't wish to use Fit all functionality, click on this button and you'll be able to drag the scene to see its remote parts.

Global panning - allows to define the center of the scene presenting all displayed objects in the visible area.

Draw Points - switches display mode to Points. In this mode, each curve is displayed as a set of points.

Draw Lines - switches display mode to Lines. In this mode, each curve is represented as a set of plain line segments.

Draw Splines - switches display mode to Splines. In this mode, each curve is represented as a spline.

Normalization to global minimum by left Y axis - switches normalization mode to Left Y Axis: Minimum normalization. In this mode, all curves are normalized to the global minimum by the left Y axis.

Normalization to global maximum by left Y axis - switches normalization mode to Left Y Axis: Maximum normalization. In this mode, all curves are normalized to the global maximum by the left Y axis.

Normalization to global minimum by right Y axis - switches normalization mode to Right Y Axis: Minimum normalization. In this mode, all curves are normalized to the global minimum by the right Y axis.

Normalization to global maximum by right Y axis - switch normalization mode to Right Y Axis: Maximum normalization. In this mode, all curves are normalized to the global maximum by the right Y axis.


These buttons allow to switch horizontal axis scale to the linear or logarithmic mode.
- Note
- The logarithmic mode of the horizontal axis scale is allowed only if the minimum value of abscissa component of displayed points is greater than zero.


These buttons allow to switch vertical axis scale to the linear or logarithmic mode.
- Note
- The logarithmic mode of the vertical axis scale is allowed only if the minimum value of ordinate component of displayed points is greater than zero.

Show Legend - Shows / hides information about the displayed objects in a legend.

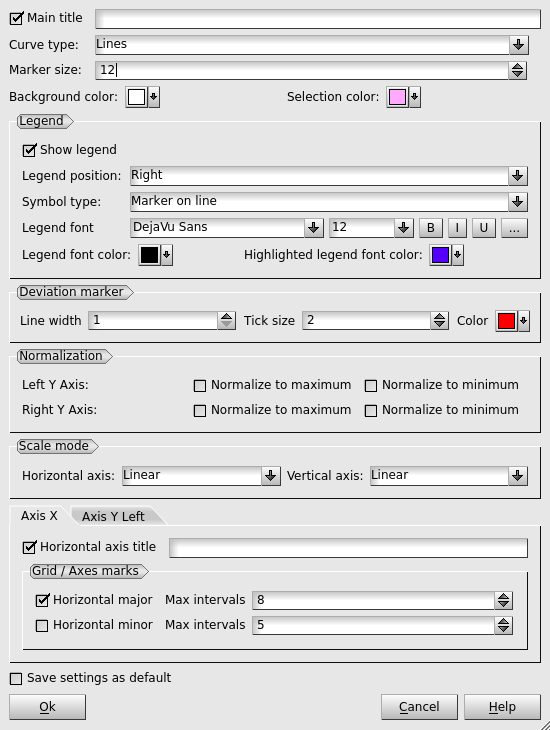
Settings - provides an access to the settings dialog box, that allows to specify advanced parameters for the Plot 2d Viewer.

The following options are available:
- Main title is the XY plot title. By default, it contains the names of tables, from which the curve lines are constructed.
- Curve type allows selecting from Points, Lines or Spline.
- Marker size - size of the points (markers) forming curve lines.
- Background color of the XY plot.
- Selection color - defines the color of selected object in the viewer.
Legend specifies the legend properties.
- Show legend - specifies if the legend is shown by default.
- Legend Position allows positioning the description table on XY plot (to the Left, to the Right, on Top or on Bottom).
- Symbol type allows positioning the legend item symbol: "Marker on line" or "Marker above line".
- Legend font allows setting font variant, size and style for legend items.
- Legend font color allows selecting the font color for legend items.
- Highlighted legend font color allows selecting font color for selected legend items.
Deviation marker specifies the properties of the marker, which is used for drawing deviations data.
- Line width line width of the marker.
- Tick size size of the upper and lower horizontal lines of the marker.
- Color color of the marker.
- Normalization allows selecting the type of normalization (minimum or/and maximum) for the displayed presentations of 2d curves in the view.
- Scale mode allows selecting the type of scaling (Linear or Logarithmic) for X (Horizontal) or Y (Vertical) axes separately. Note that the Logarithmic scale can be used only if the minimum value of corresponding component (abscissa or ordinate) of all points displayed in the viewer is greater than zero.
Axis ... options group allows specifying additional settings for each axis separately:
- Axis title - an axis title.
- Grid / Axes marks allows defining the maximum number of major and minor scale divisions for a given axis. The real number of intervals fits to {1,2,5}*10^N, where N is a natural number, and does not exceed the maximum.
- Save settings as default If this check box is marked, all XY plots will be displayed with these defined properties.

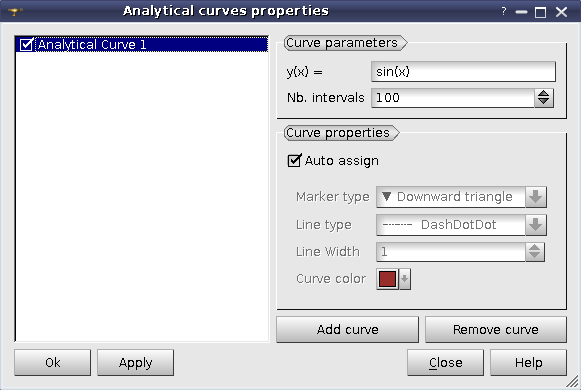
Analytical curves - provides an access to the analytical curves dialog box that allows to add, remove and modify analytical curves for the Plot 2d Viewer.

The options are as follows:
Curve parameters:
- y(x)= allows specifying a python expression, which is used to calculate the coordinates of the curve points, where x corresponds to the horizontal range, shown in plot 2D viewer.
- Nb. itervals allows specifying the number of the curve points.
Curve properties:
- Auto assign if checked, the properties (Line type, Line width, Marker type and Color) are assigned to curves automatically. To define the curve properties manually, uncheck this control.
- Line type allows to choose curve line type from None, Solid, Dash, Dot, Dash - Dot and Dash - Dot - Dot.
- Line width allows to specify line width of the curve.
- Marker type allows to choose curve marker type from Circle, Rectangle, Diamond, Rightward Triangle, Leftward Triangle, Downward Triangle, Upward Triangle, Cross and Diagonal Cross).
- Color allows specifying the curve color.

Clone view - opens a new duplicate scene.

Print view - prints the current view scene.